Module 1 / 2
Volume Profile - POC, Value Area, HVN, LVN
Volume Profile is not an indicator. It is a way of organising the same transaction data you see on the volume sub-chart, but sorted by price rather than by time. It answers the question: "At what price did the market trade the most, and where did it refuse to trade?".
- Author
- Zordon Intelligence Sp. z o.o.
- Updated
- 7 min read
- Structure sources
- 2
Volume Profile is not an indicator. It is a way of organising the same transaction data you see on the volume sub-chart, but sorted by price rather than by time. It answers the question: “At what price did the market trade the most, and where did it refuse to trade?”.
If the previous lesson told you that price without volume lies, this lesson shows you how to measure where the truth about value was written down.
Volume Profile anatomy
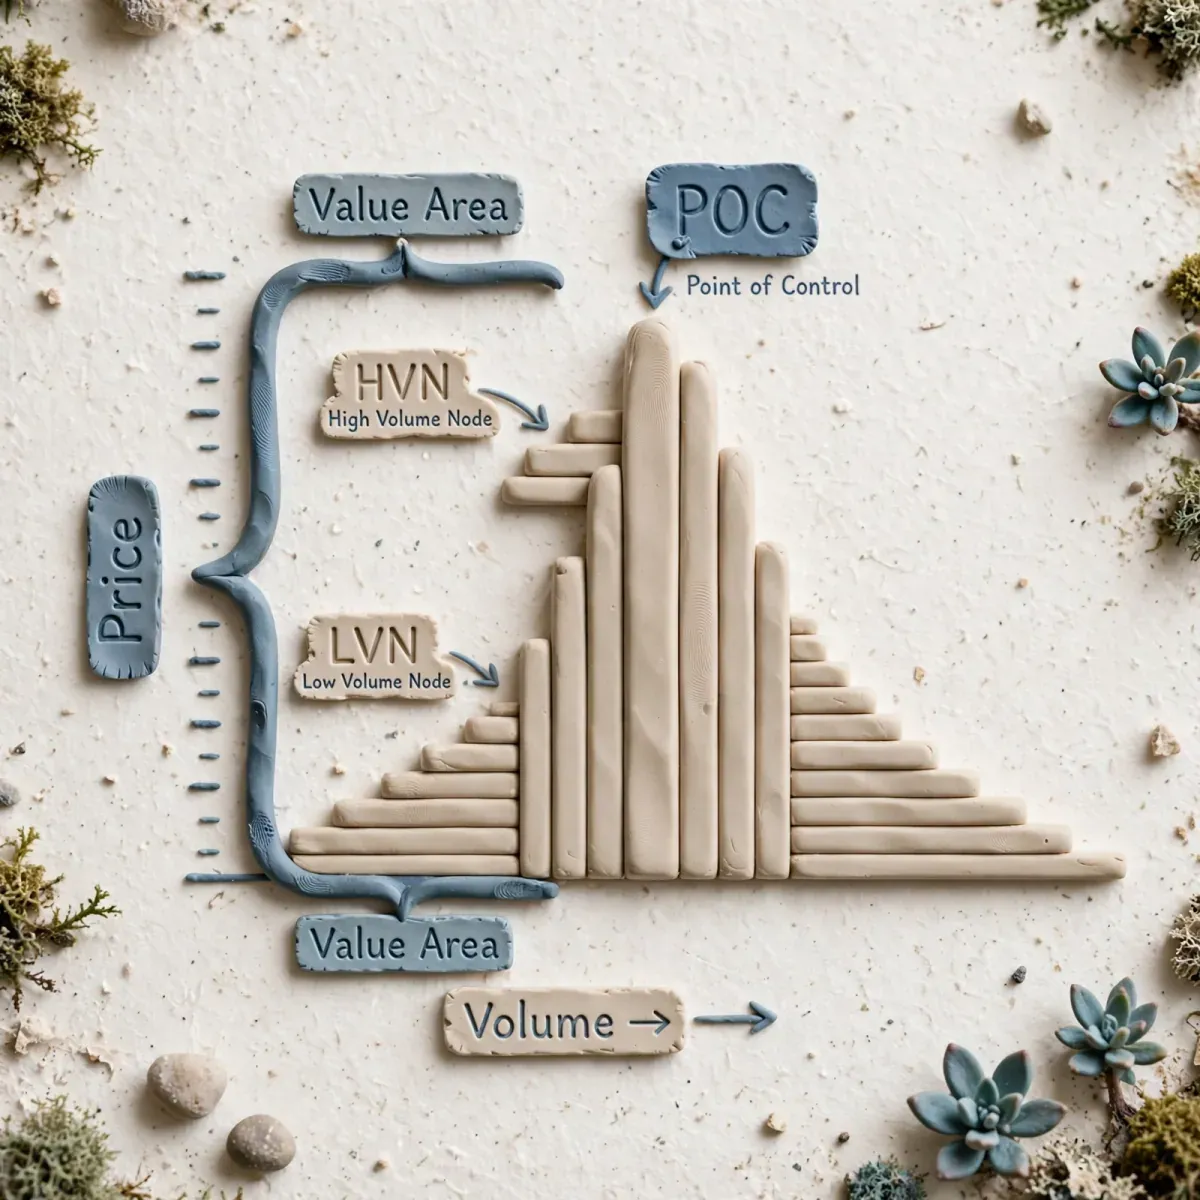
Imagine taking all the transactions from a given period (a day, a week, a month) and laying them out horizontally on the price chart. Where the bar is longest, there was the most trading.
The components:
- POC (Point of Control): The price with the highest volume in a given profile. It is the most honest price according to the market in that period. The level where the most business was done and which is considered “fair”.
- Value Area (VA): The area where 70% of the total volume of the session/period took place. A concept from auction theory: 68.2% ~ one standard deviation. In practice - the range of accepted value.
- VAH (Value Area High) - the upper boundary of the Value Area
- VAL (Value Area Low) - the lower boundary of the Value Area
- HVN (High Volume Node): A price group with clearly elevated volume relative to its surroundings. The market spent time there and accepted it as value. It acts as a magnet and as support/resistance.
- LVN (Low Volume Node): A volume gap. Price flew through it quickly because there were no willing traders. The market rejected that area. It acts like a vacuum - price comes back into it quickly, but does not want to stay there.
Value Area construction:
1. Find the POC
2. Sort the price levels in descending order by volume
3. Add the volume of the levels surrounding the POC one by one until the sum = 70% of the profile's total volume
4. The highest and the lowest level in that sum are the VAH and the VAL

Formal definition:
POC = argmax( Volume_at_Price )
VA = [VAL, VAH] such that sum(Volume in VA) = 0.70 * sum(Volume total)
How to read the shape of the profile
The shape of the profile is a record of intent:
| Shape | Description | Meaning |
|---|---|---|
| D Shape (balanced) | A large HVN in the middle, narrow tails. The most common. | Balance, two-way trading. Trade from the edges of the VA towards the POC. |
| P Shape | Large volume at the top | Buyers piled in at the high and got trapped, distribution. Often after a long uptrend. |
| b Shape | Large volume at the bottom | Sellers dominated at the bottom, accumulation. |
| B Shape | Two HVNs separated by an LVN | Two equilibria. The market jumped and is building new value. The LVN in the middle is the decision point. |
The longer the market spends time at a given level, the more important that level is. An HVN from a monthly profile matters more than an HVN from one hour.
POC - a reference level, not a signal
Beginners treat the POC as a line price is supposed to bounce off. A professional treats the POC as a road.
Rules for working with the POC:
- Previous session’s POC: If we open today above yesterday’s POC and Value, the market is valued higher - a long edge, as long as it does not come back into the middle of the Value.
- POC as a magnet: When the market is in an LVN, it most likely heads for the nearest HVN/POC. The void gets filled.
- POC shifting: If the day’s POC shifts higher with every hour, that is an upward auction in a trend. Buyers are raising their bids.
- Naked POC: A POC that has not been touched for many sessions. An untested level with high historical volume. A zone with a high probability of price coming back.
Measuring POC strength:
Volume_at_POC / Average_Volume_per_Price_Level > 1.8 means a significant POC
If the day's POC = the week's POC = the month's POC -> POC confluence, the highest-weight level
Value Area - the game for acceptance
70% of volume is not an accident. It is a statistical model of value.
Auction rules:
- Trading inside Value: If price is inside yesterday’s Value Area, it is a balanced, rotational day. Look for mean reversion: VAL -> POC -> VAH.
- Trading outside Value: If price is outside Value, the market is searching for new value. Check whether it is building new volume there (acceptance) or there is none at all (rejection and a return).
- Value Area as a trend filter: Two days in a row of Value rising higher (a VAL above the previous day’s VAH) is a strong trend. Declining Value is controlled distribution.
| Where price is today | Yesterday’s Value | What it means and what you measure |
|---|---|---|
| Open inside the VA | - | A balanced day, rotation 70% of the time |
| Open above the VAH | Acceptance above the VAH + volume | A search for value higher, continuation |
| Open above the VAH | Rejection, low volume above | A false breakout, a return to the VA in 80% of cases |
HVN vs LVN in practice
An HVN is a car park where the market left the car and went shopping. An LVN is a motorway it only drove through.
You use an HVN as:
- The first take profit target on a bounce from the VAL/VAH
- A place where you expect a slowdown and a reaction
- Confirmation that a support/resistance level is real (because there was volume there)
You use an LVN as:
- A zone you do not trade into the middle of. Entering an LVN is entering a void with wide stops and slippage.
- A risk gauge: if your stop is on the other side of the LVN, a single impulse can take you out.
- A target: price moves from LVN to LVN very fast. When you see price entering an LVN, do not chase it - wait for the next HVN.
When the plan says do not trade
- When the day’s profile is single distribution with a narrow VA and you want to play contrarian in the middle. No energy. A narrow VA = low accepted volatility. There is no fuel for a 2x VA rotation.
- When price is in the middle of a large LVN (a void) between two historical HVNs. There is no information about value here. Your risk-to-reward ratio is incalculable. Wait until it reaches one of the edges.
- When the weekly POC and VAH/VAL are < 0.5% apart (extreme compression). The market is at a decision point about new value. Playing in the middle is guessing the breakout. The plan says: wait for volume to build AFTER the breakout.
- When you use a Volume Profile built on tick volume from CFD rather than on real volume. The shape will be distorted. Do not mark precise levels for a stop loss on it.
The mistakes that cost the most
1. Drawing 5 profiles on one chart and calling everything support/resistance. 15 HVNs is noise. The only ones that matter are: the day’s POC, the week’s POC, yesterday’s and today’s VAH/VAL, and 1-2 historical HVNs with the highest volume. The rest is decision-making clutter.
2. Treating the POC as an indestructible barrier. The POC is a magnet, but once it is broken with volume it becomes a trampoline. If price breaks the monthly POC on 2x average volume and builds above it, it will become support, not resistance. Do not average against a broken POC with acceptance.
3. Confusing an HVN with a candle high/low. A wick can have zero volume (a pull). An HVN can sit in the middle of a candle. Look at the horizontal profile, not the vertical one.
4. Ignoring the LVN. The biggest losses come from a trader placing a limit order right in the middle of an LVN because “there was a nice gap here”. The market is not supposed to trade there. Your order will be skipped or you will catch a knife falling through the void.
Measurable exercise
- Choose WIG20 futures or FUS500 futures.
- Draw a volume profile: daily (session), weekly, monthly.
- Mark: POC D, VAH D, VAL D, POC W, POC M.
- For 10 sessions, record every day:
- Where did the open happen relative to yesterday’s VA (inside/above/below)?
- How many times did price touch POC D, and what was the reaction (a bounce of at least 0.3% or a break and acceptance)?
- What % of the time did price spend inside the VA versus outside the VA?
- After 10 days, calculate: the success rate of mean reversion to the POC when the open is inside the VA, and the success rate of continuation when the open is outside the VA with volume >120% AVG.
Estimated time: 15 minutes a day.
Journal entry:
Date | Open vs YVA | POC D | POC D touches | Reaction | Time in VA % | Conclusion
Check yourself
- How does an HVN differ from the POC, and when is an HVN more important than the POC?
- How is the Value Area determined, and why 70%?
- What does a P-shape profile at the top of a trend mean?
- What is a Naked POC and why does it attract price?
- What is the difference between trading inside Value and trading outside Value?
Frequently asked questions
Does Volume Profile work on small intervals like 5M? Yes, but as a session profile, not as a single 5-minute bar. Build the profile from the whole day with a 5M split so you can see the evolution. A profile from 5M candles alone is too little data to mark significant HVNs.
Are the VAH/VAL ready-made buy/sell signals? No. They are the boundaries of accepted value. The signal is the reaction of price + volume + delta at those levels. The VAH line on its own has no value without context. You need confirmation of rejection (for example low delta, absorption on the footprint).
How many periods back should I take for a monthly profile? Standard: the current month + 2-3 previous ones. Too long a period (a year, say) flattens all the levels and you lose the distinction of the HVNs. Too short and you only see noise.
Will the POC always be tested again? No. Some POCs, especially from directional trend days, are abandoned forever. Statistics: roughly 70-80% of daily POCs are tested within 5 days, but POCs from days with a range >2x ATR have a lower return rate. Do not build a strategy solely on a return to the POC.
Advertisement
Key takeaways
- Volume Profile is not an indicator. It is a way of organising the same transaction data you see on the volume sub-chart, but sorted by price rather than by time. It answers the question: "At what price did the market trade the most, and where did it refuse to trade?".
Structure sources
The material is based on source documents. Variable values — fees, limits, regulatory figures — are worth checking at the source before making a decision.
- Babypips — School of Pipsology — babypips.com
- TradingView — dokumentacja Pine Script
Disclaimer
- Educational material. Not investment advice or a recommendation. Trading involves the risk of losing capital.
- The materials are educational. They are not investment advice or a recommendation within the meaning of financial instruments trading regulations. Numbers in examples are illustrative unless a measurement date and source are given.
Who writes this and how we check it
The materials are written and verified by Redakcja Kurs Tradera — the rules are described on about the site: every number has a source, and we show gaps openly. Report a factual error via contact — corrections are described in the content.
Progress is stored only in this browser (localStorage) — there is no account and no copy on the server. Clearing site data will remove it. Manage your data