Module 1 / 2
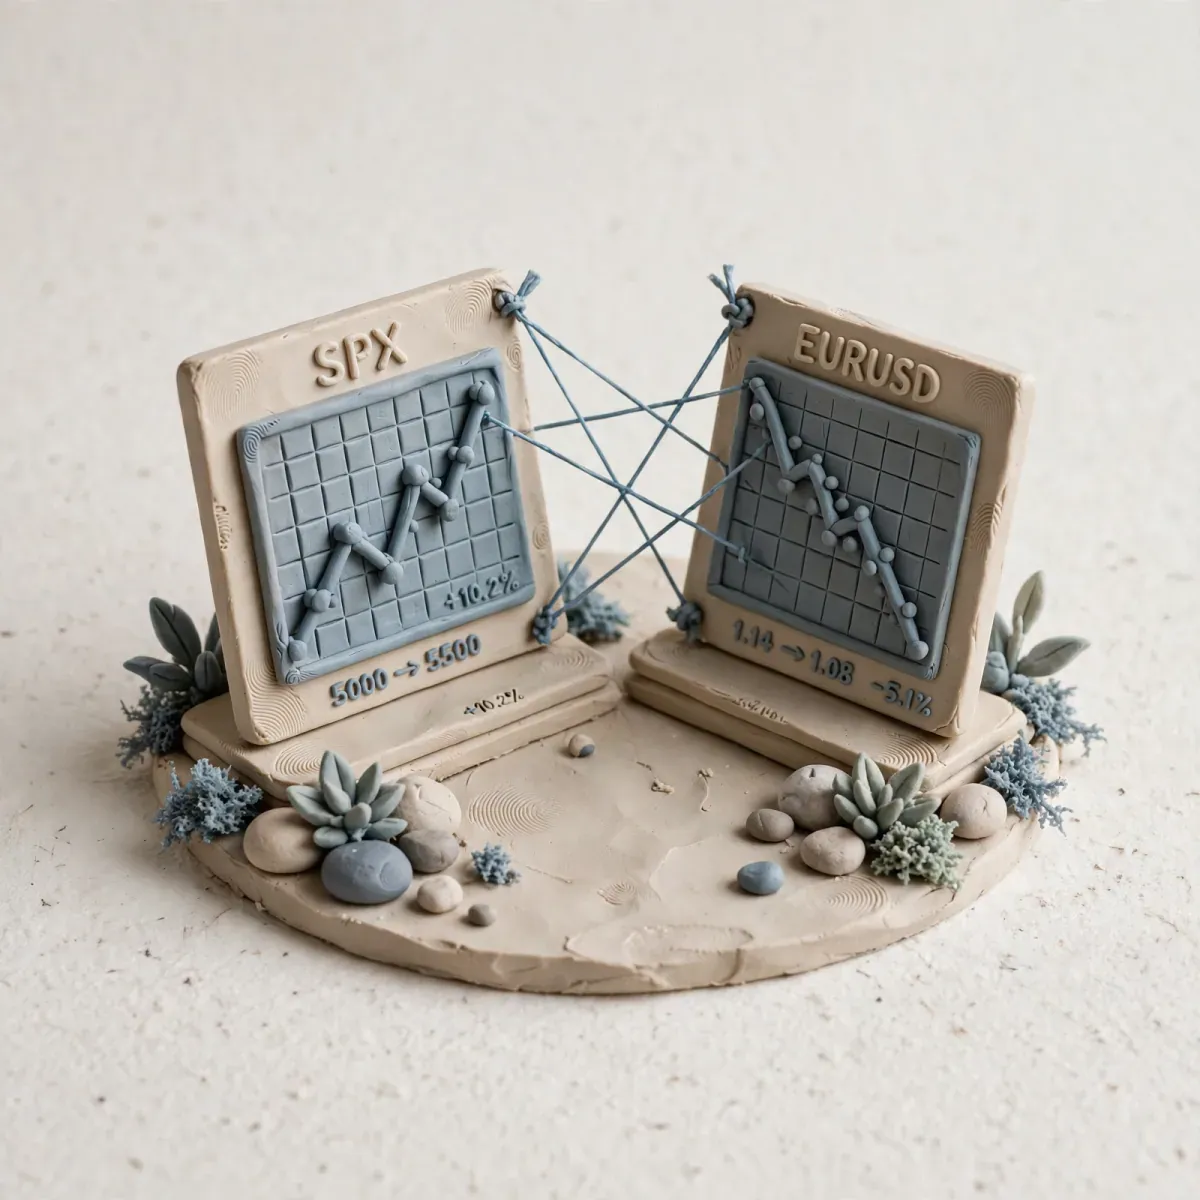
Intermarket - SPX vs EURUSD dependencies
In this lesson you will learn to map the links between stocks, currencies, bonds and commodities. You will understand why SPX drags EURUSD, why AUDJPY is the best risk-on gauge, and how to detect the moments when a correlation breaks - which is a signal of a regime change.
- Author
- Zordon Intelligence Sp. z o.o.
- Updated
- 8 min read
- Structure sources
- 2
No market moves on its own. If you look only at your own chart, you see 20% of the information. The rest is in the correlations.
In this lesson you will learn to map the links between stocks, currencies, bonds and commodities. You will understand why SPX drags EURUSD, why AUDJPY is the best risk-on gauge, and how to detect the moments when a correlation breaks - which is a signal of a regime change.
Why intermarket is not a curiosity but a filter
A beginner looks at EURUSD and hunts for a pattern. A professional looks at 4 charts before clicking on EURUSD:
- DXY - is the dollar strong globally?
- SPX / NAS100 - are we in risk-on or risk-off?
- US10Y - do yields support the move?
- Only then EURUSD - does the technical setup fit the macro?
If 3 out of 4 disagree with your EURUSD idea, your idea has a low probability.
The basic flow map (you need to know it)
Fed policy (dovish/hawkish) -> US10Y + DXY -> SPX -> risk currencies -> commoditiesAn example of a risk-on flow after a dovish CPI: CPI lower -> FedWatch odds of cuts up -> US10Y falls -> DXY falls -> SPX rises -> EURUSD rises, AUDJPY rises, gold rises.
If you see SPX rising but EURUSD not rising, it means EUR has its own problem (for example a dovish ECB). Do not ignore that divergence.
Key correlations to monitor every day
| Intermarket pair | Typical correlation | What it says when it works | What it says when it breaks |
|---|---|---|---|
| SPX vs EURUSD | +0.6 to +0.8 (risk-on) | Risk-on confirmed | Divergence = a eurozone problem or capital rotation |
| SPX vs USDCHF | -0.6 to -0.8 | The franc as a safe haven vs equities | When both rise = USD dominates, not risk |
| AUDJPY vs SPX | +0.7 to +0.9 - the best barometer | The cleanest risk-on: you buy commodity AUD and sell safe-haven JPY | A break = carry unwind, get ready for a VIX spike |
| US10Y vs NAS100 | -0.5 to -0.7 (when valuation fear hits) | High rates kill growth | When both rise = AI bubble / earnings stronger than rates |
| Gold vs US10Y real yield | -0.8 | Real yields rise = gold falls | When both rise = geopolitics / fear about debt |
| BTC vs NAS100 | +0.5 to +0.7 in risk-on | Beta to tech, liquidity | When BTC falls and NAS rises = rotation out of crypto, not a signal for NAS |
Correlations are not constant. You have to measure the rolling correlation over 20-50 days, not over the whole year.
A quick-check formula (no statistics needed):
Visual correlation: On an H4/D1 chart overlay SPX (line) and EURUSD (line). If the lows and highs line up 7 times out of 10 over the last month -> the correlation works.
If 3 times SPX makes a new high and EURUSD does not -> the correlation has broken.
For measurement use the Correlation Coefficient indicator in TradingView (period 50) on D1.
The 3-screen intermarket model - before you enter
Before you enter a position on INSTRUMENT X, check:
Screen 1: The dollar (DXY) Does DXY support your direction? A long EURUSD requires a weak DXY. A short EURUSD requires a strong DXY. If DXY is sideways, your EURUSD trade must have a smaller size.
Screen 2: Risk (SPX + VIX + AUDJPY) Does risk-on/off support your direction? Long AUDJPY plus short SPX is a contradiction. You have to pick one regime.
Screen 3: Yields (US10Y) Does US10Y support you? A long gold while US10Y prints a new daily high is a fight. A long NAS100 while US10Y is +0.15% intraday is a fight.
The filter rule:
Entry allowed when:
2 of 3 screens AGREE with your direction = permission, size 1R
3 of 3 AGREE = permission, size 1R, better confluence
0-1 AGREE = no entry, or size 0.25R as a test
Intermarket divergences - the signal of a regime change
The most important reversal signals are not on your chart. They are between markets.
Example 1: A bearish divergence between SPX and EURUSD SPX makes a new ATH, but EURUSD does not make a new high. Neither does AUDJPY. That means only 5 AI stocks are dragging SPX up, and broad risk-on is not working. This is a fragile rally. Do not join it long out of FOMO. Wait for SPX to break and for a VIX spike.
Example 2: A bullish divergence between DXY and US10Y DXY falls (dovish), but US10Y rises (hawkish). The market is confused. The dollar does not know where to go. On a day like that EURUSD will chop in both directions. Stay away.
Example 3: AUDJPY leads SPX AUDJPY often breaks down 2-3 days before SPX when a carry unwind starts (the closing of positions funded in JPY). If you trade SPX, watch AUDJPY as a leading indicator. When AUDJPY is -2% in 2 days and SPX is -0.3%, cut your SPX longs.
The early-warning formula:
If the 3-day AUDJPY change < -1.5% AND VIX +10% over 3 days, while SPX still holds its high:
→ Raise your readiness to cut. The probability of an SPX pullback >60% over the next 5 days (a historical observation, not a guarantee).
How to put it all together in an SPX vs EURUSD trading plan
Suppose you want to go long EURUSD.
The intermarket checklist (write it in your journal):
1. DXY: D1 trend? [down/sideways/up] Price vs EMA50?
2. SPX: D1 trend? Is SPX rising today? What is VIX?
3. US10Y: Trend? Is it rising or falling today? Does it support a weak USD?
4. EUR: Does the ECB have speakers today? Does the DE10Y vs US10Y spread support EUR?
5. SPX/EURUSD 20D correlation: Is it >0.5?
Decision: YES/NO, size: 0.25/0.5/1R
A filled-in example - a long EURUSD allowed: DXY in a downtrend below EMA50, SPX +0.8%, VIX 15, US10Y -0.05%, no ECB speaker, correlation 0.72 = 5/5 in agreement, size 1R.
An example - a long EURUSD FORBIDDEN: DXY in an uptrend, SPX -1.2%, VIX 24, US10Y +0.10%, correlation 0.3 (broken) = 0/5 in agreement, forbidden. Look for a short EURUSD or cash.
When the plan says do not trade
- Correlations broken on 3 out of 5 pairs. When SPX rises, DXY rises, gold rises and US10Y rises at the same time, that is not a normal regime. It is a global repricing. Your old correlations do not work. Go to cash and watch for 48h.
- On a CPI/FOMC day you try to use correlations intraday. In the minutes around a release correlations go to 1.0 or -1.0 for 5 minutes and then break. Intermarket works on D1/H4, not on M1 during news.
- You trade an exotic pair (for example USDTRY) and compare it with SPX. Exotics have their own political regime and do not follow SPX. Map only majors plus SPX/NAS.
- AUDJPY as a signal, but the Bank of Japan intervenes. When the BoJ intervenes, the JPY move is not about risk but about politics. Ignore AUDJPY as a barometer for 2-3 days.
- You hold 2 positions that are strongly correlated against each other. Long EURUSD and short DXY are the same position twice. If DXY reverses, you lose 2R instead of 1R. See lesson 06.
The mistakes that cost the most
| Mistake | Why it hurts | The fix |
|---|---|---|
| Looking at only 1 chart | You go long EURUSD while DXY and SPX show strong risk-off; you are fighting the wind | A mandatory 4-chart dashboard before every entry |
| Treating correlation as a guarantee | A correlation of 0.8 does not mean 100%. It breaks 20% of the time and those are the biggest losses | Correlation is a probability filter, not a signal. Always a SL |
| Using intermarket on M5/M15 | On low timeframes noise kills the correlation, overtrading | Intermarket only on H1/D1 as a regime filter, M15 technicals for timing |
| Ignoring bond spreads (DE10Y vs US10Y) | EURUSD is not only USD, it is also EUR - the DE vs US yield spread drives EUR | Add the DE10Y-US10Y spread to your dashboard (TradingView indicator: TUTUT) |
A measurable exercise
Correlation map - 30 days
- In TradingView add the Correlation Coefficient indicator on D1, period 50.
- Every day write down:
Date | SPX/EURUSD corr | SPX/AUDJPY corr | DXY/SPX corr | Gold/US10Y real corr- Mark the days when the correlation changes sign (for example from +0.6 to -0.1). What happened in the macro 2-3 days earlier?
- After 30 days answer:
- Which pair has the most stable correlation?
- How many times did the correlation break, and was it followed by a bigger move with VIX >20?
Goal: you will understand which correlations are your real filter and which are noise.
Test yourself
1. You want to go long SPX. DXY rises +0.7%, AUDJPY falls -0.8%, VIX +12%. What does intermarket say? a) It confirms the long b) It contradicts it, this is risk-off, a long SPX has a low probability c) It does not matter
Correct: b) 3 barometers against. This is not an environment for a long SPX without a strong bullish divergence.
2. Why do you check the DE10Y-US10Y spread when trading EURUSD? a) Because it looks nice b) Because it shows the difference in expectations for the ECB vs the Fed, which drives EURUSD beyond DXY itself c) Because the banks do it and you have to copy them
Correct: b) EURUSD is a differential pair. If German yields rise faster than US yields, EUR gets support regardless of SPX.
3. AUDJPY breaks down -2% in 2 days, SPX holds its highs. What do you do? a) Nothing, AUDJPY has no link to SPX b) Alert: a possible carry unwind, I cut long risk on SPX and raise my guard on VIX c) I buy AUDJPY because it is cheap
Correct: b) AUDJPY is a leading indicator for risk-off. It often leads SPX by 1-3 days.
Frequently asked questions
Q: How many correlations should I monitor? Will I go crazy? A: 4-5 is enough. DXY, SPX, AUDJPY, US10Y, XAU. The rest are derivatives of those. Better to measure 5 every day than 15 once a week.
Q: Do correlations work during the Asian session? A: Less well. USD liquidity is lower and the JPY driver is local (BoJ). The best intermarket read is the London session plus the NY open (14:00-17:00 CET).
Q: Can I automate the dashboard? A: Yes. A TradingView watchlist plus 4 charts in a layout. Or a Google Sheet with the GOOGLEFINANCE function for DXY, SPX and VIX. The key is not the technology but the daily habit of checking.
Q: What if the SPX-EURUSD correlation is 0.1? A: That means there is no global regime. The market is driven by local factors. Cut your size by 50% and trade only the clean technicals on that instrument, without expecting support from SPX.
Advertisement
Key takeaways
- In this lesson you will learn to map the links between stocks, currencies, bonds and commodities. You will understand why SPX drags EURUSD, why AUDJPY is the best risk-on gauge, and how to detect the moments when a correlation breaks - which is a signal of a regime change.
Structure sources
The material is based on source documents. Variable values — fees, limits, regulatory figures — are worth checking at the source before making a decision.
- Central banks — publications from the Fed, the ECB and the National Bank of Poland (NBP) — nbp.pl
- BIS — annual economic reports
Disclaimer
- Educational material. Not investment advice or a recommendation. Trading involves the risk of losing capital.
- The materials are educational. They are not investment advice or a recommendation within the meaning of financial instruments trading regulations. Numbers in examples are illustrative unless a measurement date and source are given.
Who writes this and how we check it
The materials are written and verified by Redakcja Kurs Tradera — the rules are described on about the site: every number has a source, and we show gaps openly. Report a factual error via contact — corrections are described in the content.
Progress is stored only in this browser (localStorage) — there is no account and no copy on the server. Clearing site data will remove it. Manage your data