Module 1 / 2
Demand and supply zones vs support and resistance
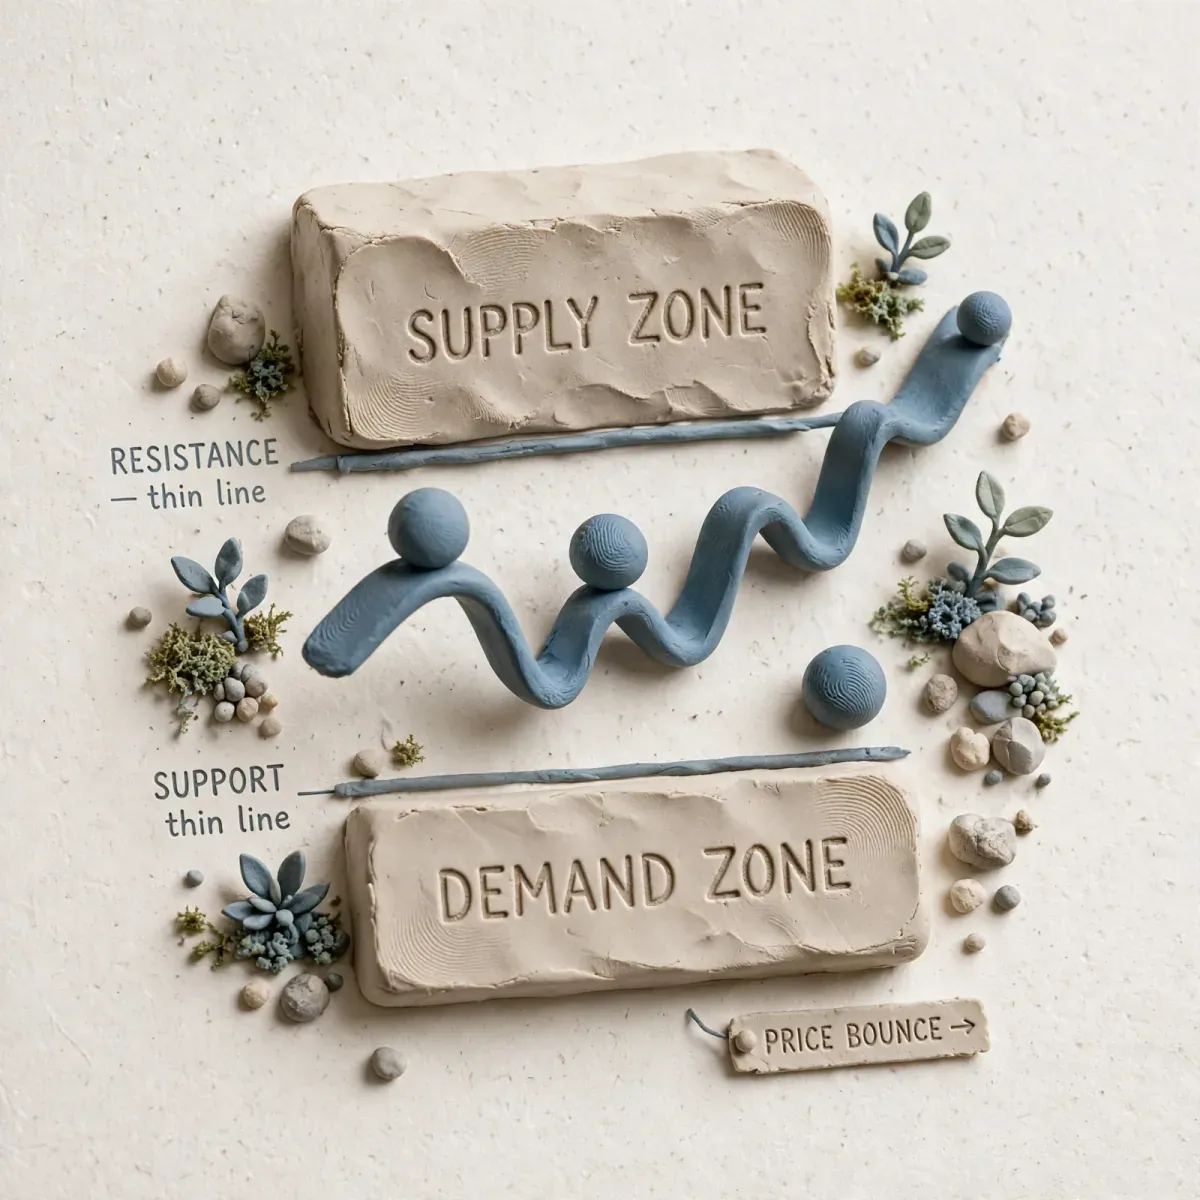
Beginners draw a support and resistance line. A price action trader draws a zone — the area where an imbalance between demand and supply occurred in the past. The difference is not semantic. A line gives the illusion of tick-level precision, a zone teaches humility and risk management with...
- Author
- Zordon Intelligence Sp. z o.o.
- Updated
- 7 min read
- Structure sources
- 2
Introduction
Beginners draw a support and resistance line. A price action trader draws a zone — the area where an imbalance between demand and supply appeared in the past. The difference is not semantic. A line gives the illusion of tick-level precision; a zone teaches humility and risk management inside a decision area.
In this lesson we will deconstruct what a demand/supply zone is, how it differs from classic support/resistance, how to mark it correctly, how to judge its strength, and how to use it in a plan without guessing whether it will “bounce perfectly off the line”.
Support and resistance — the psychological and historical level
Support: A price level where demand has historically appeared and slowed declines.
Resistance: A level where supply has historically appeared and slowed advances.
The problem with a line: the market rarely reacts to the tick. Price drops sharply below support, takes out stops and comes back. If your stop is 1 tick below the line, you get taken out.
That is why a line is a simplification. The professional approach is a zone.
Demand and supply zones — a definition built on imbalance
Demand zone: The area from which a strong bullish impulse left, leaving an imbalance behind. It shows where large buyers were aggressive.
Supply zone: The area from which a strong bearish impulse left.
The key: a zone is not “a place where price once turned around”. It is a place where the decision was fast and impulsive, with large bodies and a break of structure.
How do you recognise a valid zone?
- A strong departure impulse: After the zone forms, price leaves quickly, with large bodies and ideally with a BOS. The stronger the impulse, the stronger the zone.
- A clear base: A narrow consolidation of 1-6 candles before the impulse. A base that is too wide means no aggression.
- Few retests: An untested zone is the strongest. Every retest consumes orders.
| Feature | Strong zone | Weak zone |
|---|---|---|
| Departure impulse | Large bodies, <20% wicks | Small bodies, many wicks |
| Time spent in the zone | 1-4 candles | >8 candles, many shadows |
| Number of returns | 0-1 (fresh) | 3+ (used) |
| Formed after a liquidity sweep | Yes | No, in the middle of a range |
Operational differences: S/R vs supply/demand
| Criterion | Support/resistance (line) | Demand/supply (zone) |
|---|---|---|
| Drawing | A single horizontal line through a wick/close | A rectangle: from the start of the base to the end of the impulse (the last opposite candle) |
| Stop-loss | Behind the line | Behind the zone + a buffer |
| Entry | On a touch of the line | In the zone + confirmation of a reaction (LTF CHOCH, engulf) |
| Strength | Number of bounces | Quality of the departure + freshness |
| Most common mistake | Stop just behind the line = liquidity grab | A limit entry without confirmation in a weak zone |
How to mark a zone step by step (protocol)
For a demand zone:
- Find a strong bullish impulse (min 2x ATR).
- Go back to the last bearish candle before the impulse.
- The zone runs from the low of that bearish candle to the high/low of the consolidation. Mark it as a rectangle.
- Extend it to the lowest wick in the base.
For a supply zone:
- Find a strong bearish impulse.
- Go back to the last bullish candle before the impulse.
- The zone runs from the high of that bullish candle to the range of the base.
Demand zone - marking:
BaseStart = Open/Close of the last bearish candle before the impulse
BaseEnd = Low of that candle (the lowest point of the base)
Entry = BaseEnd (start of the base)
Invalidation = Close below the zone + 0.2 ATR buffer

Supply zone - marking:
BaseStart = Open/Close of the last bullish candle before the impulse
BaseEnd = High of that candle
Invalidation = Close above the zone + buffer
Good zones should have a ratio of at least 1:3 between the height of the zone and the distance to the next high/low. If the zone is 50 pips tall and the next swing is 30 pips away, there is no sensible R:R.
Zone classification: freshness and quality
Fresh zone: Price has never returned to the zone after it formed. The highest quality.
Tested zone: 1 return that produced a reaction. Still valuable, but weaker.
Used zone: 2+ returns. The probability of a break grows. Do not trade it with a limit order.
Record in your journal:
| Date | Instrument | Zone type | Fresh/Tested/Used | Impulse (ATR) | Retest result | R-multiple |
|---|
After 30 samples you will see which quality works on your market.
Entry confirmation inside a zone
Naked trading does not mean placing limit orders blindly inside a zone. You need confirmation from the LTF.
A long scenario in a demand zone:
- Price enters an HTF zone (for example H4 demand).
- You switch to the LTF (for example M15).
- You wait for a bullish CHOCH on the LTF + an upward BOS on the LTF.
- Entry after the LTF BOS, stop below the low of the HTF zone.
This links lessons 2 and 3: the HTF zone gives the context, the LTF structure gives the timing.
When the plan says do not trade
- The zone is wider than 40% of the distance to the target: Bad R:R. If the zone is 100 pips and the target 120 pips, the maths is against you.
- Price has spent more than 8 candles in the zone with no reaction: Price acceptance inside the zone means the demand/supply is negated. You leave, you do not add.
- The zone sits in the middle of an HTF consolidation with no BOS: Trading zones inside a range ends in random false moves. You need a break out of the consolidation first.
- The zone is “overtrained” — 4+ retests: The textbook beginner mistake: “it always bounced here”. Consumed orders = a break.
- The zone formed in low volatility (Asia with no impulse) while you trade in high volatility: The strength of the impulse has to match the session and the ATR.
The mistakes that cost the most
- Drawing a zone every 20 pips. If you have 15 zones on the chart, you have none. Limit: the 2-3 nearest fresh demand and supply zones around the price.
- A limit entry without confirmation in a used zone. The most common reason for losses: “the zone looks good” -> limit -> break. Always require an LTF CHOCH/BOS after price enters the zone.
- A stop-loss in the middle of the zone. The zone is a decision area. If you place the stop in the middle, you accept randomness. The stop has to be behind the zone + a buffer.
- Confusing an S/R flip with a strong zone. A flip (old resistance = new support) is weaker than a fresh impulsive demand zone. Do not weight them the same.
- No measurement. You do not record whether fresh demand actually delivers better R than used. Without measurement you keep repeating the myth.
Measurable exercise
Task: ranking zones
- Pick an H1 market, go back 200 candles.
- Mark 10 demand/supply zones according to the protocol (a strong impulse + a narrow base).
- For each one, score:
- Freshness (0/1/2+)
- Impulse strength in ATR (for example 1.5 ATR)
- Zone width in ATR
- Scroll forward and see what happened on the first return.
Quality Score formula:
Q = (Impulse_ATR * 2) - (Width_ATR) - (RetestCount) + FreshBonus(1 if fresh)

Example: impulse 2.5 ATR, width 0.6 ATR, 0 retests → Q = 5 - 0.6 - 0 +1 = 5.4
Goal: trade only Q >= 4
After 20 zones, count the reaction hit rate for Q >=4 vs Q <4. That will be your filter.
Check yourself
- Draw the difference: how would you mark a resistance line vs a supply zone on the same swing?
- Why does a fresh zone have a statistically higher chance of a reaction than a zone tested 3 times?
- You have a demand zone 80 pips wide and the nearest swing high 100 pips above the zone. What is the max R-multiple with a stop behind the zone?
- Describe an LTF confirmation scenario for an entry into an H4 supply zone.
- What does price acceptance inside a zone for 8 M15 candles mean?
Frequently asked questions
Is a demand/supply zone the same thing as an order block? An order block is a subtype of a demand/supply zone, narrowed to the last opposite candle before the impulse. A zone can cover several base candles. Order blocks are covered in detail in lesson 5.
Is it better to use the close or the wick to draw a zone? For precision, use the extremes of the wicks in the base — they show the full range of transactions where the imbalance was. For invalidation, use a close outside the zone + a buffer, to filter out wick hunting.
How many zones should I have on the chart? At most 3-4: the nearest fresh demand, the nearest fresh supply, and possibly one significant HTF flip zone. More zones = decision paralysis and forcing entries.
Do zones work on stocks and ETFs? Yes, because stocks and ETFs also have places of demand/supply aggression. On illiquid stocks zones can be wider because of gaps. Always allow for the spread and gaps when you set the stop-loss.
I have a demand zone and a supply zone close to each other — what do I do? That is a consolidation. Do not trade the breakout inside it without a BOS. Wait until price picks a direction and prints a BOS outside the consolidation; then the new direction will show you which zone to treat as the target.
Advertisement
Key takeaways
- Beginners draw a support and resistance line. A price action trader draws a zone — the area where an imbalance between demand and supply occurred in the past. The difference is not semantic. A line gives the illusion of tick-level precision, a zone teaches humility and risk management with...
Structure sources
The material is based on source documents. Variable values — fees, limits, regulatory figures — are worth checking at the source before making a decision.
- Babypips — School of Pipsology — babypips.com
- TradingView — Pine Script documentation
Disclaimer
- Educational material. Not investment advice or a recommendation. Trading involves the risk of losing capital.
- The materials are educational. They are not investment advice or a recommendation within the meaning of financial instruments trading regulations. Numbers in examples are illustrative unless a measurement date and source are given.
Who writes this and how we check it
The materials are written and verified by Redakcja Kurs Tradera — the rules are described on about the site: every number has a source, and we show gaps openly. Report a factual error via contact — corrections are described in the content.
Progress is stored only in this browser (localStorage) — there is no account and no copy on the server. Clearing site data will remove it. Manage your data