Module 2 / 2
Fiscal policy vs monetary policy - who deals the cards
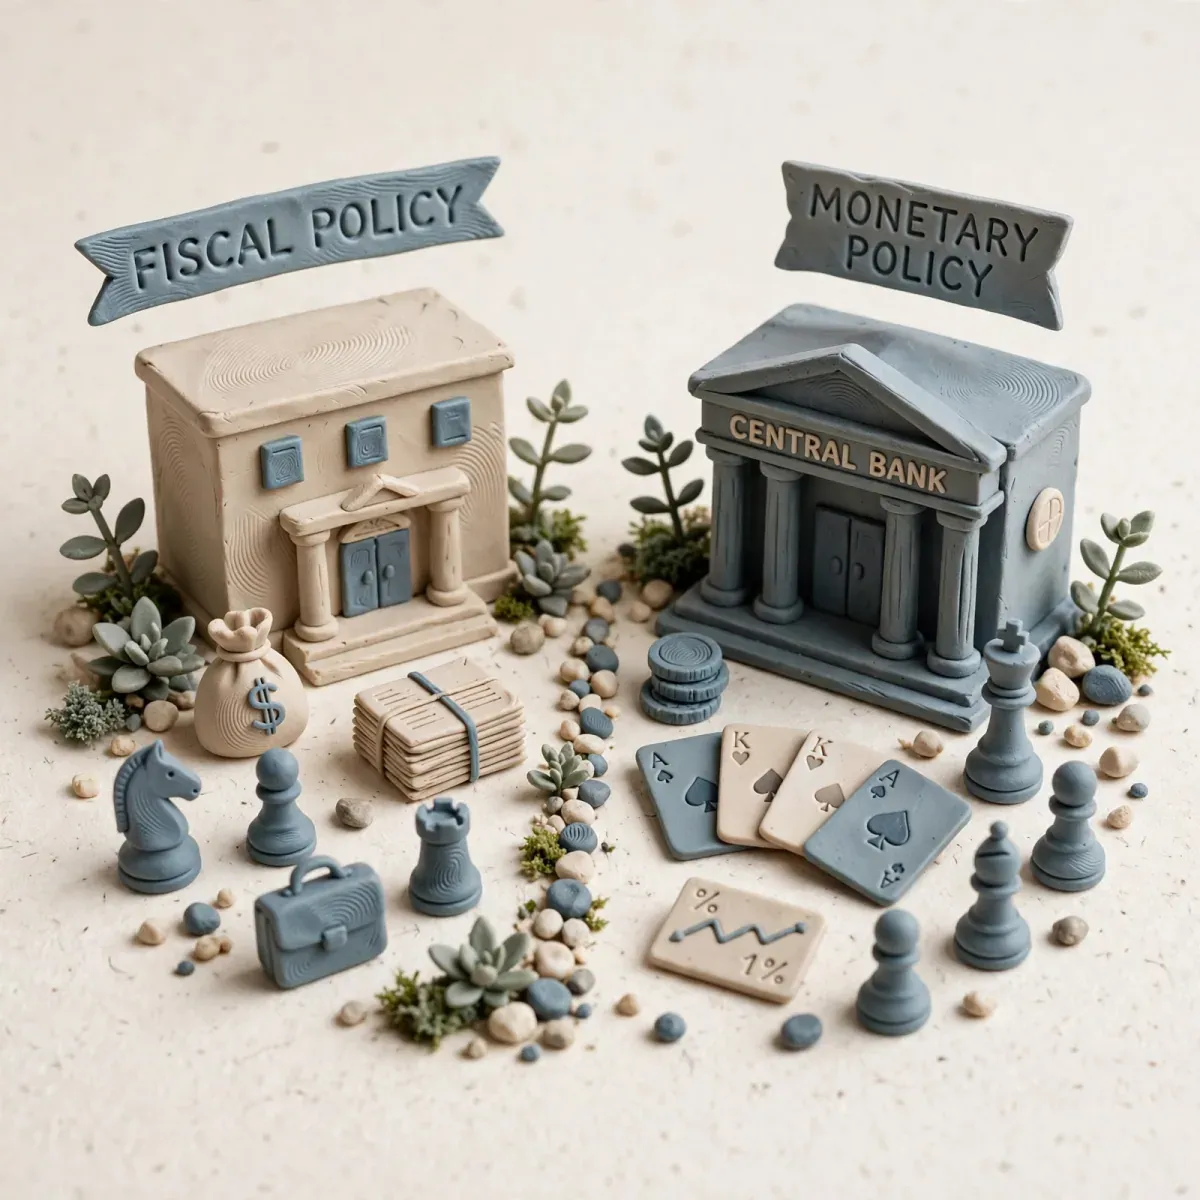
There are two players in the market with more firepower than all traders combined: the government (fiscal policy) and the central bank (monetary policy). One decides how much to borrow and where to spend it, the other decides what borrowing costs. When they act together, they create a bull market. When...
- Author
- Zordon Intelligence Sp. z o.o.
- Updated
- 7 min read
- Structure sources
- 2
There are two players in the market with more firepower than all traders combined: the government (fiscal policy) and the central bank (monetary policy). One decides how much to borrow and where to spend it, the other decides what borrowing costs. When they act together, they create a bull market. When they act against each other, they create chaos. A trader who does not know who is running the game in a given quarter is trading blind.
This lesson puts the dependencies, the transmission and the conflicts in order – and teaches you how to measure them without guessing.
Monetary policy – the central bank manages the price and the quantity of money
The central bank’s tools:
- Interest rate: the short-term anchor we discussed in lesson 3.
- Balance sheet (QE/QT): buying/selling bonds. QE – printing reserves and increasing liquidity, QT – draining them. QE lowers long yields and credit spreads, QT does the opposite.
- Reserve requirement and repo operations: technical, but they decide overnight liquidity. When repo is strained, liquidity disappears even with low rates.
The declared goal: price stability (2% inflation) and sometimes full employment (the Fed has a dual mandate). The unspoken goal: financial stability – when something breaks (as with the US regional banks in March 2023), the central bank intervenes even if inflation is high.
For a trader, monetary policy means:
- The direction of the cost of money: are real rates rising or falling?
- The direction of liquidity: is the balance sheet growing or shrinking?
- The direction of communication: hawkish or dovish?
Fiscal policy – the government manages demand through the budget
The government’s tools:
- Spending (G): transfers, public investment, purchases. They go straight into GDP.
- Taxes (T): a tax cut = more disposable income for consumers and firms.
- Deficit and debt: the government finances spending with debt. A large deficit at full employment – that is procyclical heating of the economy.
Deficit = G - T. When the government spends more than it collects, it has to issue bonds. Who buys them? The market, or… the central bank under QE.
The key indicator: Fiscal impulse – the change in the deficit adjusted for the cycle. If the deficit grows when the economy is already hot, the impulse is positive and inflationary.
Fiscal_Impulse = (Deficit_t / GDP_t) - (Deficit_{t-1} / GDP_{t-1})

Positive -> the government adds demand
Negative -> the government withdraws demand (fiscal tightening)
How they interact – 4 regimes you have to know
The most important table in this course:
| Regime | Monetary policy | Fiscal policy | What happens in the markets | Example |
|---|---|---|---|---|
| 1. Loose cooperation | Easing, low rates, QE | Large spending, low taxes | Strong growth, a bull market in everything, inflation rises later | USA 2020-2021 |
| 2. Tightening cooperation | Rate hikes, QT | Spending cuts, tax hikes | Braking, high recession risk, bear markets | USA 2022-2023 (partly) |
| 3. Conflict: fiscal easing + monetary tightening | High rates | Large deficit | High long-bond yields, a strong dollar, pressure on growth, but the economy holds up thanks to spending | USA 2023-2024 |
| 4. Conflict: monetary easing + fiscal tightening | Rate cuts | Austerity, deficit cuts | Low rates, but weak growth, no demand, selective risk-on | Europe 2013-2016 |
A trader loses the most in regimes 3 and 4, because the intuition from regime 1 is still running. In regime 3, “the government is spending a lot, so stocks must be doing well” – but the Fed is holding rates at 5.5% and 10Y yields of 4.8% eat into valuations. In regime 4, “the Fed is cutting, so I buy everything” – but the government is tightening its belt and the consumer has no money.
The indicator of the dispute between them:
Dominance = (Change_in_Central_Bank_Balance_Bn + Rate_Impact) vs (Change_in_Deficit_Bn)

If the Deficit grows faster than the Balance sheet shrinks -> Fiscal dominates
If the Balance sheet shrinks and Rates rise despite the Deficit -> Monetary dominates
Check it in the data: Fed QT of 95 bn/month + a US deficit of 1.7 trillion a year = who supplies more “fuel”?
When the plan says DO NOT TRADE
- When both policies change direction in the same week. For example, the RPP (Monetary Policy Council) raises rates while the government announces a big spending programme. The market does not know what to price – bonds see fiscal risk, stocks see monetary braking. Volatility jumps, direction is random.
- When public debt is close to the limit and politicians are playing for a debt-ceiling hike. Liquidity in the system falls, because the Treasury is hoovering up cash (TGA grows). That is pure liquidity risk, not something you can play with company analysis.
- When you trade on the basis of only one policy. Example: you see only rate cuts (a dovish Fed) and you buy REITs, ignoring the fact that the government has just raised property taxes and cut a subsidy programme. Monetary gives, fiscal takes away.
- When fiscal announcements are unquantifiable. “A big green-energy package – 500 bn”. No breakdown by year, no funding source, no bill. That is a narrative, not a flow. Do not build a position on it.
The mistakes that cost the most
1. Believing in the “Fed put” always and everywhere. The Fed put is the conviction that the Fed will defend a falling market with a rate cut. When the deficit is 7% of GDP and inflation is 4%, the Fed cannot cut – fiscal blocks monetary. In 2022 many traders bought the dip counting on the put – they got another -20%.
2. Ignoring the supply of bonds. A large deficit = a large issuance of bonds. Large issuance + Fed QT = more bonds on the market than willing buyers. The effect: yields rise even though inflation is falling. An equity trader does not look at the Treasury auction calendar and is surprised why his ETF drops on the day of a big 10Y auction.
3. Confusing short-term with long-term fiscalism. A one-off stimulus cheque is a demand injection for one quarter. A permanent corporate tax cut is a change for years. The first gives a jolt, the second changes the trend. Traders play both the same way.
4. No measurement of regulatory risk. Fiscal policy is also regulation, tariffs, sector taxes. A company’s profit can disappear with a single windfall-tax act. If you do not track the fiscal risk of the sector you are trading, you are trading an incomplete picture.
A measurable exercise [25 minutes]
Goal: Determine who dominates now – fiscal or monetary.
Steps for the USA (do the same for PL/EU):
- Download: the Fed balance sheet (FRED: WALCL) for the last 3 months, the Fed Funds rate and the US budget deficit (FRED: MTSDS133FMS).
- Calculate the monthly changes:
Change_in_Balance = WALCL_t - WALCL_{t-1} (QT is a negative value)
Monthly_Fiscal_Impulse = (Spending - Revenue)_t - average_12m- In a spreadsheet, draw two lines: the cumulative change in the balance sheet + rates (a proxy for tightening) vs the fiscal impulse.
- Fill in the table:
| Month | Change in the Fed balance sheet (bn) | Fed rate (change in bp) | Deficit (bn) | Who dominates? |
|---|---|---|---|---|
| M-2 | ||||
| M-1 | ||||
| Last |
- Check the correlation: when fiscal dominated, how did, for example, an ETF on small caps (IWM) behave versus large caps (SPY)? Write down the conclusion.
Pass criterion: You have a 3-month table and you can say in one sentence: “Currently fiscal easing financed at the long end with monetary tightening – yields under upward pressure, favouring value sectors over growth” (an example – your sentence may be different, but it has to be based on numbers).
Test yourself
1. The government increases the deficit by 2% of GDP, the Fed simultaneously runs QT and keeps rates high. This is regime: a) 1 – loose cooperation b) 3 – conflict: fiscal easing vs monetary tightening c) 2 – tightening cooperation
Correct: b) This is the classic USA 2023-2024 – a strong consumer thanks to spending, but high borrowing costs and yields.
2. What is “crowding out” in market practice? a) The crowd pushes you out of the market b) A large supply of Treasury bonds crowds out demand for corporate bonds – their yields rise, financing becomes harder for firms c) The phenomenon does not exist
Correct: b) A large deficit financed by the market raises the cost for everyone.
3. Why can a 30-year bond auction move the stock market? a) It cannot, it is a different market b) A weak auction = low demand for duration = the market demands a higher premium = yields up = lower stock valuations c) Only if the government announces bankruptcy
Correct: b) Auctions measure real demand for fiscal debt. A weak bid is a signal of liquidity strain.
Common questions
In Poland, is fiscal or monetary more important for the WIG? Historically both: the NBP (National Bank of Poland) sets the cost of the zloty and short-term rates, but a large deficit and the borrowing needs of the State Treasury set the Polish 10Y, which is the anchor for bank and real-estate valuations. In a high-deficit regime, WIG-Banks likes high rates, but is afraid of the growing credit risk from fiscal tightening.
How do you tell QE from ordinary purchases? Intention and durability count. QE is a large, announced programme of balance-sheet expansion plus forward guidance that it will last. Ordinary repo operations are patching overnight liquidity – they do not change the trend.
Can fiscal policy cause inflation even with high rates? Yes. If the deficit is financed and goes directly into consumption (transfers), and the economy’s supply cannot keep up, you get demand-pull inflation that rates alone will not kill without a recession. That is the scenario of the 1970s and partly of 2021-22.
This is not investment advice. The government and the central bank are two sources of systemic risk – measure who is dealing the cards in a given quarter.
Advertisement
Key takeaways
- There are two players in the market with more firepower than all traders combined: the government (fiscal policy) and the central bank (monetary policy). One decides how much to borrow and where to spend it, the other decides what borrowing costs. When they act together, they create a bull market. When...
Structure sources
The material is based on source documents. Variable values — fees, limits, regulatory figures — are worth checking at the source before making a decision.
- Central banks — publications from the Fed, the ECB and the NBP (National Bank of Poland) — nbp.pl
- BIS — annual economic reports
Disclaimer
- Educational material. Not investment advice or a recommendation. Trading involves the risk of losing capital.
- The materials are educational. They are not investment advice or a recommendation within the meaning of financial instruments trading regulations. Numbers in examples are illustrative unless a measurement date and source are given.
Who writes this and how we check it
The materials are written and verified by Redakcja Kurs Tradera — the rules are described on about the site: every number has a source, and we show gaps openly. Report a factual error via contact — corrections are described in the content.
Progress is stored only in this browser (localStorage) — there is no account and no copy on the server. Clearing site data will remove it. Manage your data