Module 1 / 2
GDP, CPI, NFP, PMI – how to read the key indicators
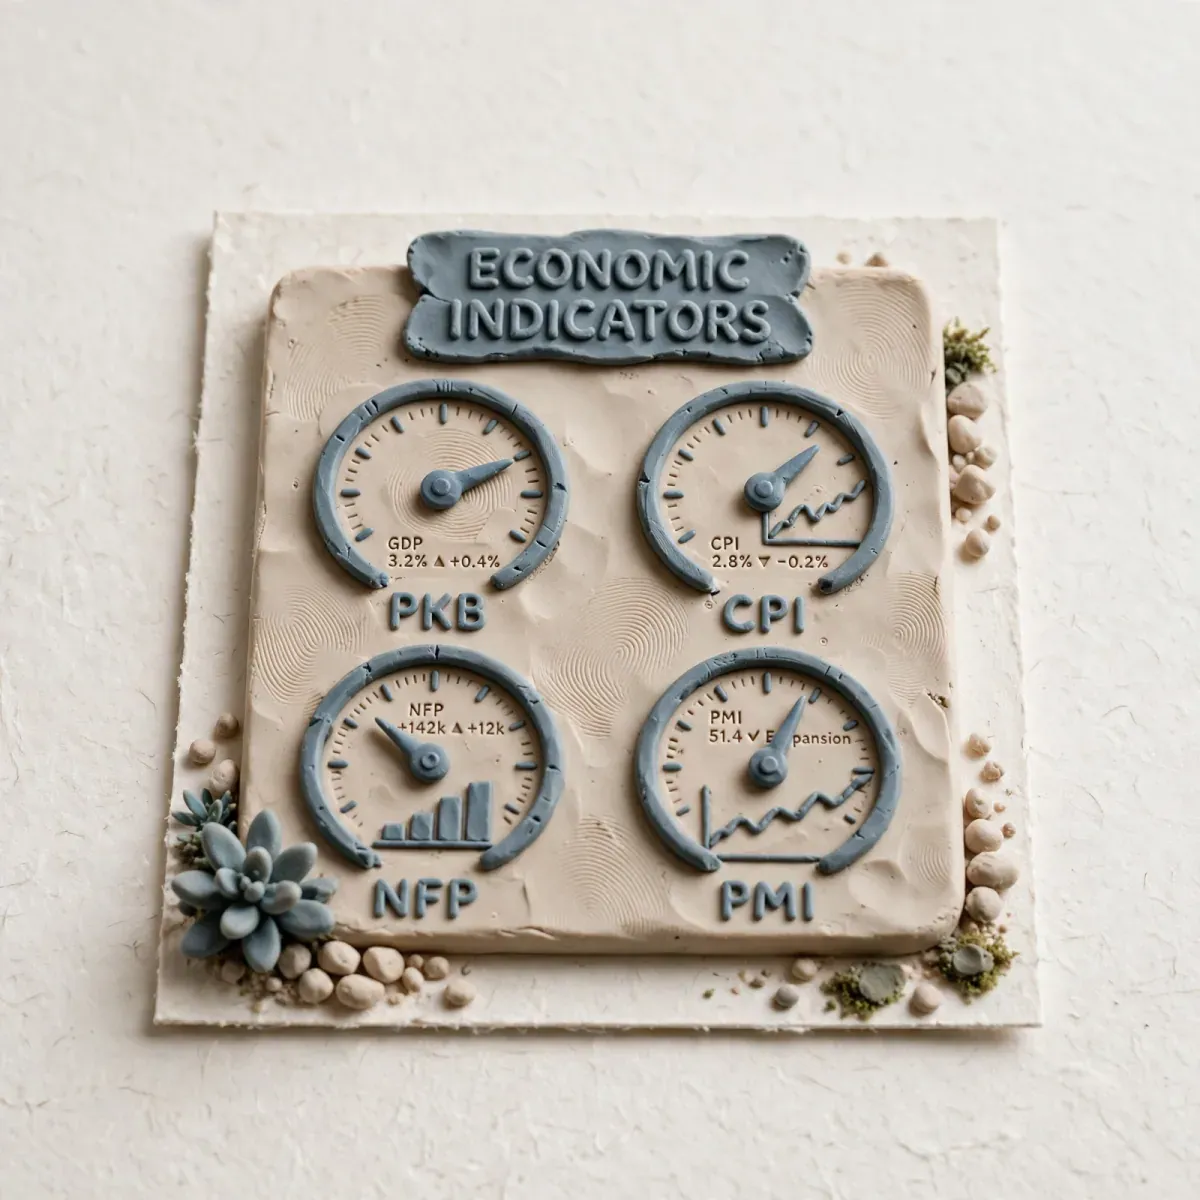
The economic calendar is not a list of events, it is a map of future volatility. GDP, CPI, NFP and PMI are the four indicators that most often shift expectations about interest rates, and through them the prices of stocks, ETFs and currencies. The problem is that most traders read them like...
- Author
- Zordon Intelligence Sp. z o.o.
- Updated
- 7 min read
- Structure sources
- 2
The economic calendar is not a list of events, it is a map of future volatility. GDP, CPI, NFP and PMI are the four indicators that most often shift expectations about interest rates, and through them the prices of stocks, ETFs and currencies. The problem is that most traders read them like headlines: “better/worse than the forecast”. That is not enough. What counts is context: the trend, the revision, the base component and the market reaction.
This lesson teaches you to read an indicator like a professional: what it measures, how it lies and how to write it into your plan without guessing.
GDP – Gross Domestic Product: where we are, not where we are going
GDP measures the value of all goods and services produced in an economy. For a trader, GDP is a lagging indicator, but it sets the narrative about the health of the economy and about the peak or the trough of the cycle.
What you have to check:
- Year-on-year (y/y) growth versus annualised quarter-on-quarter (q/q): y/y smooths, q/q shows the turn.
- Composition: is consumption (C) growing, investment (I), or only inventories and government spending (G)?
- Revisions: GDP is revised 3 times. The market remembers the second revision more strongly than the first.
GDP on its own rarely triggers a violent intraday move, but it changes expectations for the whole quarter. Weak GDP + high CPI = stagflation – the hardest environment for growth stocks.
CPI – consumer inflation: the fuel for central banks
CPI (Consumer Price Index) is the most important indicator for monetary policy. Central banks do not react to the inflation you complain about in the shop, only to what the CPI basket measures.
The key distinction:
| Measure | What it contains | Why it matters for a trader |
|---|---|---|
| CPI Headline | Everything, including food and energy | The headline that moves the algorithms |
| CPI Core | Excluding food and energy | What the Fed/ECB looks at, less volatile |
| CPI m/m | Month-on-month change | Shows the moment of the turn, not covered by the base |
| CPI y/y | Year-on-year | The base effect – a high base a year ago understates today |
The market reacts not to the reading itself, but to the deviation from the consensus and to the m/m momentum. Example: CPI y/y 3.2% against a forecast of 3.3% is “lower”, but if m/m is 0.4% versus 0.2% previously – the trend is accelerating. The algorithms will sell the first 30 seconds on the headline, professionals will assess core m/m.
Inflation_Surprise = Current_Reading - Consensus
Inflation_Momentum = CPI_Core_m/m_current - CPI_Core_m/m_previous

If Surprise > 0 and Momentum > 0 -> strong hawkish signal (higher rates)
If Surprise < 0 and Momentum < 0 -> dovish signal
NFP – non-farm payrolls: the pulse of the US economy
Non-Farm Payrolls, published on the first Friday of the month, is the most frequent generator of volatility on the markets. Why? It combines three pieces of information: the number of new jobs, the unemployment rate and wage growth (Average Hourly Earnings).
How to read it:
- Headline NFP versus the consensus and the revisions: the revisions of the 2 previous months add up to the reading. NFP +100k, but revisions -80k, is a weak reading.
- Unemployment rate (Unemployment Rate): it rises more slowly than NFP falls – people are returning to the labour market.
- Wages (AHE): for the Fed more important than NFP itself. Wage growth of 0.4% m/m is pressure on services inflation.
NFP is not about whether people have a job. It is about whether the Fed has a reason not to cut / to keep raising rates.
PMI – the leading indicator of business sentiment
PMI (Purchasing Managers Index) is a survey of purchasing managers. Above 50 = expansion, below 50 = contraction. It is a leading indicator, while GDP is lagging.
Two key PMIs:
- Manufacturing PMI: sensitive to global trade and cycles.
- Services PMI: accounts for 70% of the US economy, so it matters more for inflation.
Traders look at:
- New Orders: the most leading component.
- Prices: the prices sub-index in PMI is an early signal for CPI.
- ISM versus S&P Global: in the US, ISM has historically carried more weight.
| Indicator | Type | Market reaction | What to measure |
|---|---|---|---|
| GDP | Lagging | Low intraday, high quarterly | Consumption vs inventories |
| CPI Core m/m | Coincident | Very high | Trend, not y/y |
| NFP + AHE | Coincident | Very high | Revisions + wages |
| PMI New Orders | Leading | Medium | Whether below 50 two months in a row |
When the plan says DO NOT TRADE
- 15 minutes before and after CPI / NFP, if you have no plan for both scenarios. The spread widens 5-10x, slippage eats your edge. If your model has no defined reaction to a deviation of 2 standard deviations, you are not prepared.
- When the reading is internally contradictory. For example NFP +250k (strong), but unemployment rising to 4.1% and wages 0.1% m/m. The algorithms will buy, then sell. You are left with the whipsaw.
- When you only trade the headline. If you see only the headline “GDP 2.1% vs 2.0% forecast” without a breakdown into components, you do not have information, only a headline.
- When data from different countries give contradictory signals for the same instrument. For example a strong PMI from Germany and a weak PMI from the US on the same day for EUR/USD. Without a correlation model it is a coin toss.
Mistakes that cost the most
1. Trading the deviation without the context of the trend. CPI 0.1% lower after 8 months of increases is not the end of inflation. The market often falsely breaks out, and then returns to the m/m trend.
2. Ignoring revisions. 70% of a macro analyst’s work is revision analysis. NFP 180k against a forecast of 200k looks weak, but if the previous month was revised from 150k to 210k, net it is a rebound, not a weakening.
3. Confusing the level with the momentum. GDP at a level of 2% y/y sounds good, but if it is falling from 3.5% y/y a quarter ago, the economy is slowing. Traders lose because they look at the number, not at the vector.
4. FOMO on the first candle. The greatest volume after data comes in the first 30 seconds. That is where the spread is widest and where institutions close positions, not open them. If you enter in the first minute without a limit order, you pay a tax on emotion.
Measurable exercise [20 minutes]
Goal: Build a journal of reactions to 4 indicators.
Choose the last 3 readings of CPI, NFP and PMI for the US (12 readings in total).
For each one write down:
Date | Indicator | Consensus | Reading | Revision | Surprise | S&P500_15min_Reaction | S&P500_4h_Reaction | ConclusionSteps:
- Go to Investing.com / ForexFactory / a central bank calendar.
- Calculate Surprise = Reading - Consensus.
- Check on the chart: how did the S&P 500 / DAX / your ETF behave in the 15 minutes after the data and 4 hours after the data.
- Answer: was the direction after 15 min held after 4h? In what % of cases? That is your measure of false breakouts (false breakout rate).
Pass criterion: You have at least 9 rows filled in and a calculated indicator: % agreement of the 15min vs 4h direction. If it is < 60%, you already know that trading the first candle has no measurable edge.
Check yourself
1. CPI headline 3.1% y/y vs 3.2% forecast, but CPI core m/m 0.4% vs 0.3% previously. How do you interpret it? a) A dovish signal, because the headline is lower b) A hawkish signal, because core inflation momentum is accelerating c) Neutral, because the two balance each other out
Correct: b) The Fed looks at core m/m and the trend. The headline can fall on fuels, which the Fed ignores.
2. NFP 50k vs 180k forecast, but the previous month’s revision is +90k and wages +0.5% m/m. Which matters more? a) Only the weak NFP, so the market must rise (rate cuts) b) The package: net weaker on jobs, but wages point to inflationary pressure – a mixed signal = high whipsaw risk c) Wages do not matter
Correct: b) Never read NFP without the revisions and the wages.
3. Services PMI falls from 52.3 to 49.8, and the New Orders sub-index falls from 53 to 47. What does that suggest? a) Further slowdown in the coming months b) Nothing, because PMI is only a survey c) An immediate rise in GDP
Correct: a) 2 months below 50 and falling new orders is a classic leading signal.
Frequently asked questions
Which indicator is the most important? For equity markets in an inflationary cycle: CPI core m/m and AHE (the wages from NFP). For a bull market driven by growth: PMI New Orders and margins. The weight changes with the cycle.
Do I need to know the data from Poland, or only from the US? If you trade the WIG20, you need to know GUS CPI (Statistics Poland) and the decisions of the RPP (Monetary Policy Council). If you trade global ETFs, the US sets the cost of money and the correlations. In practice both – but the US sets 70% of trading time.
Why does the market sometimes rise after bad data? Because the market discounts future rates, not the present. Weak GDP can mean faster rate cuts = support for valuations. This is the so-called “bad news is good news” in the late phase of tightening.
This is not investment advice. We are learning to read indicators in order to measure volatility risk, not in order to forecast price.
Advertisement
Key takeaways
- The economic calendar is not a list of events, it is a map of future volatility. GDP, CPI, NFP and PMI are the four indicators that most often shift expectations about interest rates, and through them the prices of stocks, ETFs and currencies. The problem is that most traders read them like...
Structure sources
The material is based on source documents. Variable values — fees, limits, regulatory figures — are worth checking at the source before making a decision.
- Central banks — publications from the Fed, the ECB and the NBP (National Bank of Poland) — nbp.pl
- BIS — annual economic reports
Disclaimer
- Educational material. Not investment advice or a recommendation. Trading involves the risk of losing capital.
- The materials are educational. They are not investment advice or a recommendation within the meaning of financial instruments trading regulations. Numbers in examples are illustrative unless a measurement date and source are given.
Who writes this and how we check it
The materials are written and verified by Redakcja Kurs Tradera — the rules are described on about the site: every number has a source, and we show gaps openly. Report a factual error via contact — corrections are described in the content.
Progress is stored only in this browser (localStorage) — there is no account and no copy on the server. Clearing site data will remove it. Manage your data